Data visualisation translating complex energy policy, investment incentives, and grid operations into a clear narrative of California’s renewable transition.
Client: Fairtide
Role: Data Visualisation Designer
Timeline: 1 day
More Projects
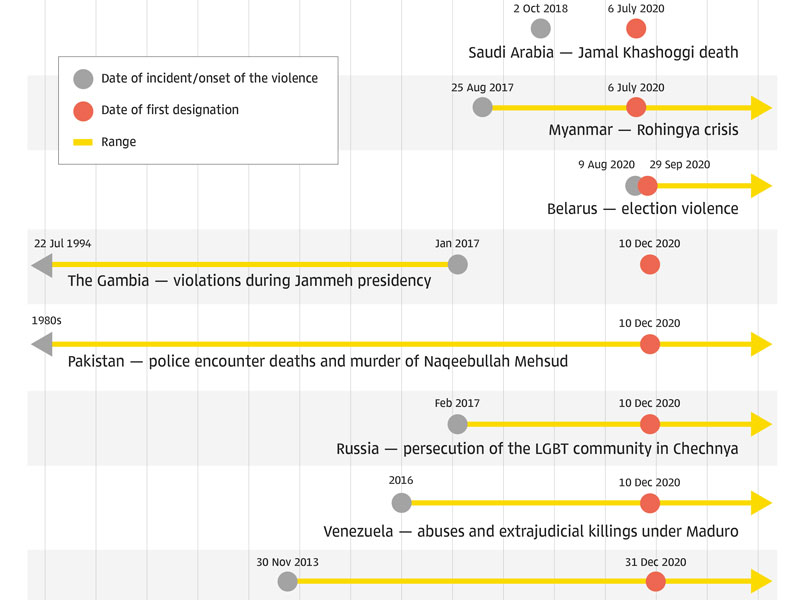
Human Rights Accountability Timeline
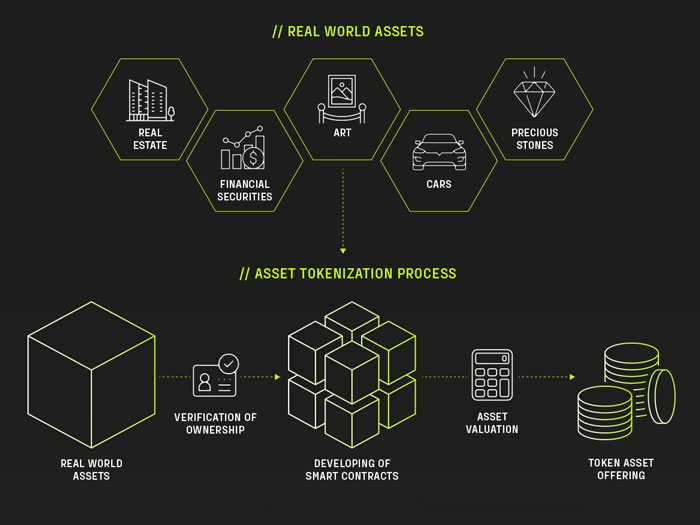
Real World Asset Tokenization
Every arrival has a beginning
Commercial operations strategy input for a pharmaceutical board