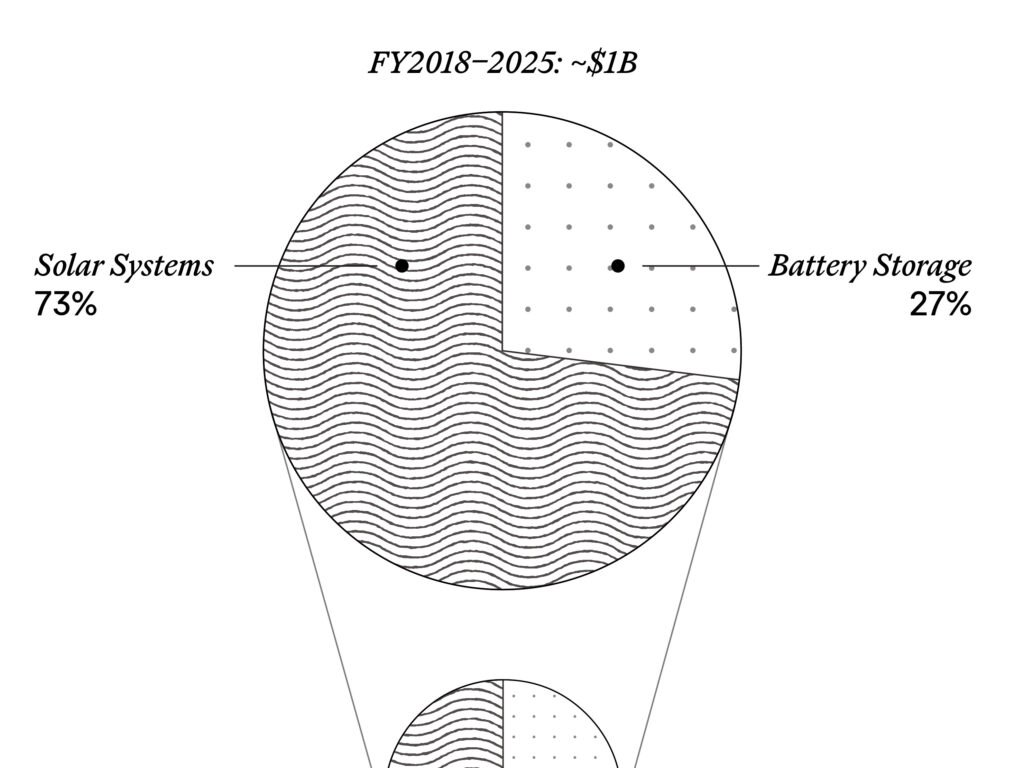
Renewable Investment Reshaping California’s GridData visualisation translating complex energy policy, investment incentives, and grid…
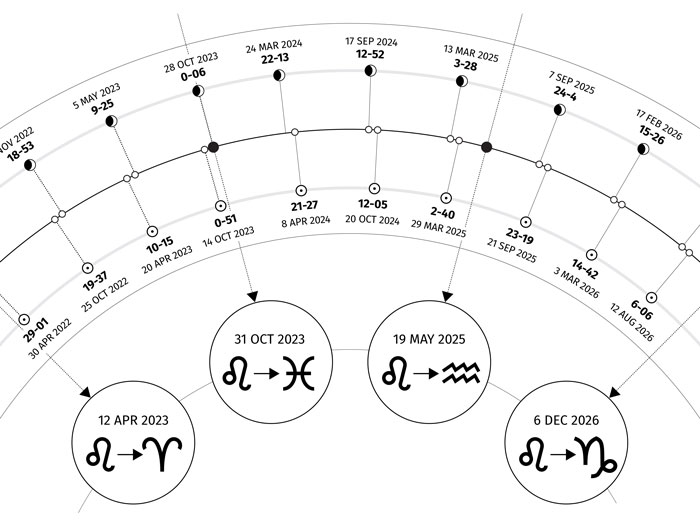
Astrological Cycle DiagramAn astrological reference diagram visualising cycles, transits, and lunar phases…
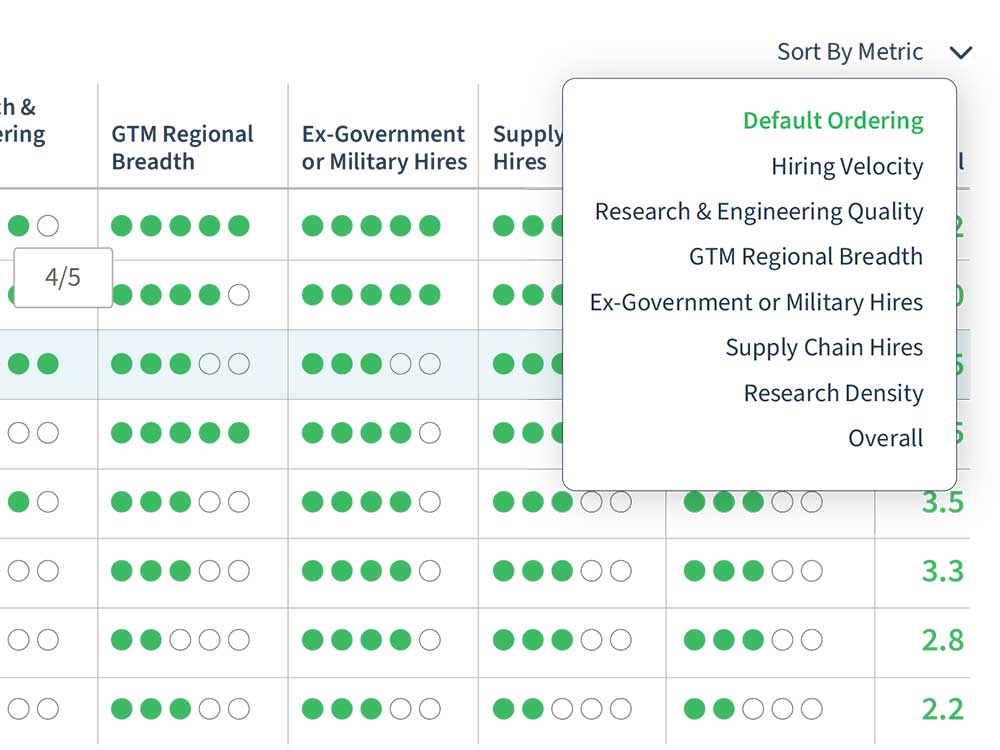
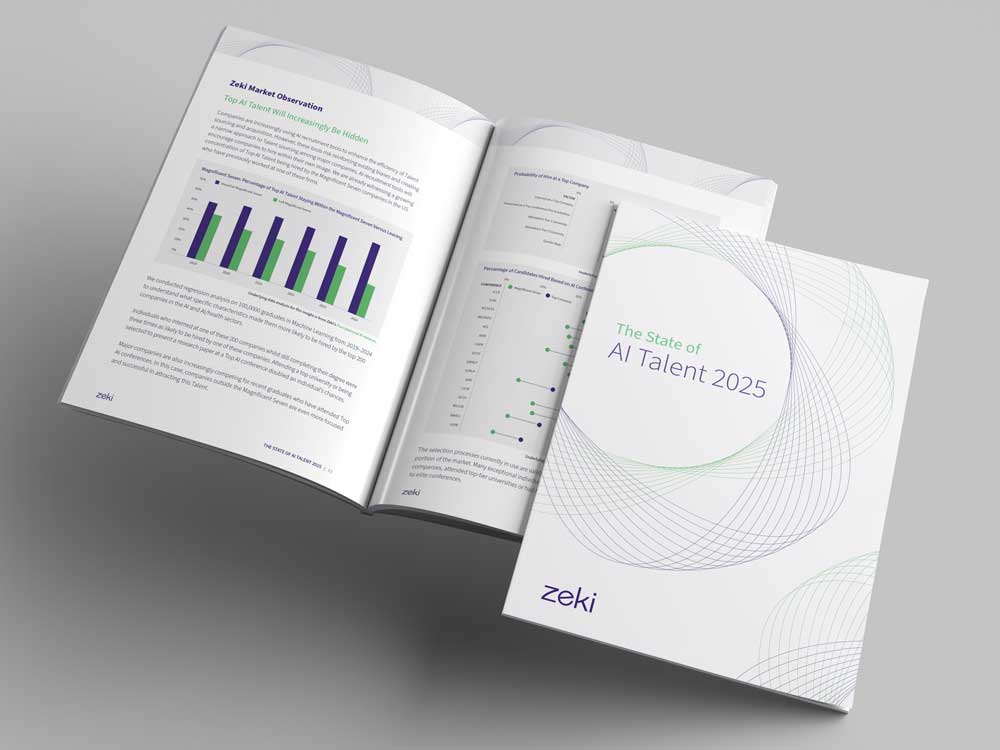
Interactive Talent Intelligence ChartsA series of interactive charts for Zeki’s talent intelligence work.…
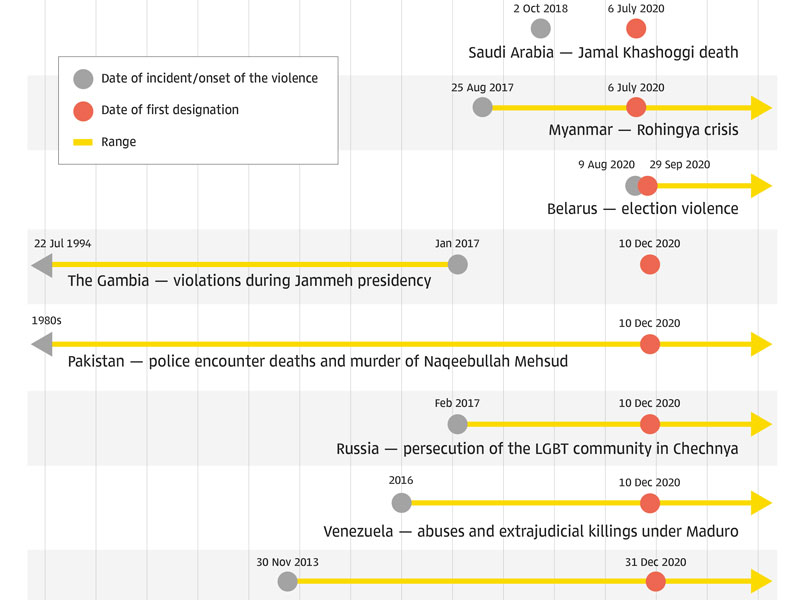
Human Rights Accountability TimelineDesigned a timeline infographic comparing the dates of major human…
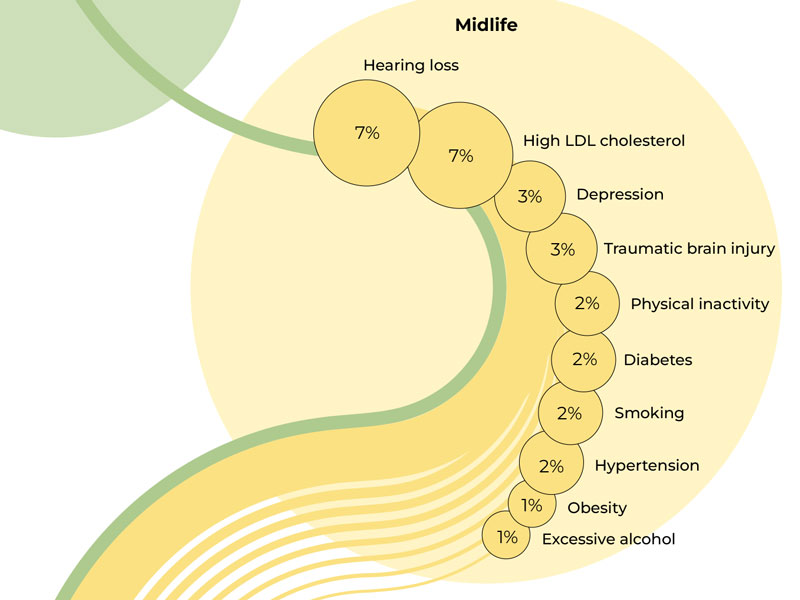
Dementia Risk Factors InfographicAn infographic visualising modifiable risk factors for dementia across life…
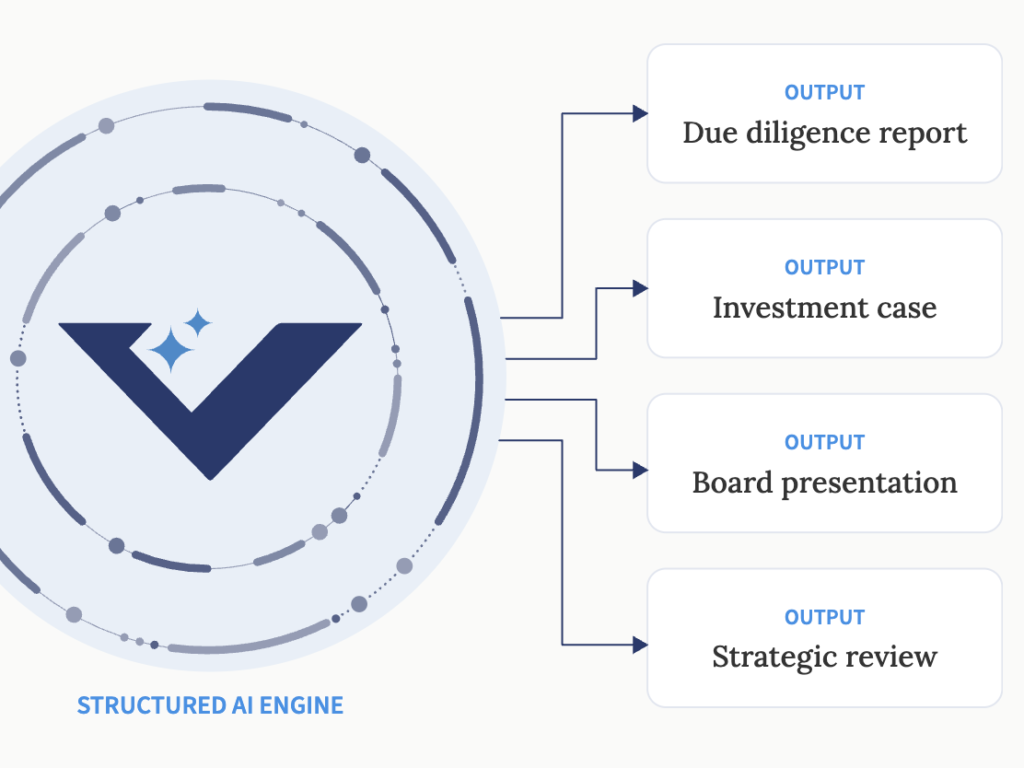
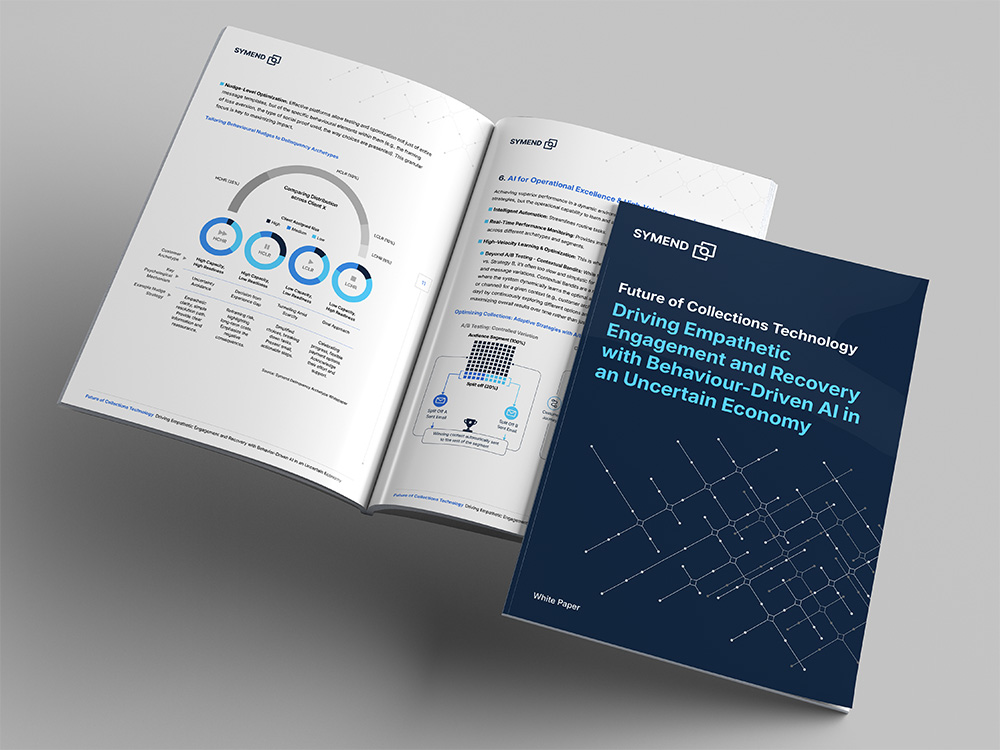
Structured AI Engine System DiagramA system diagram visualising how Velocity Insights’ AI engine transforms…
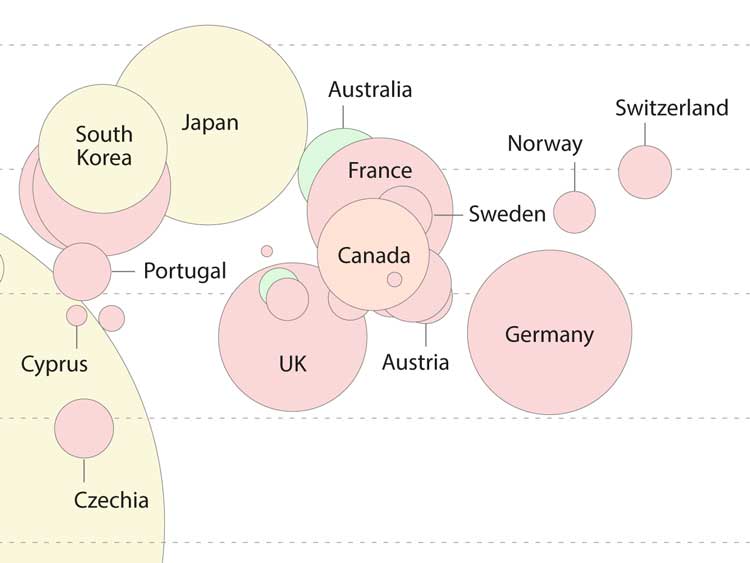
Health Spending and Life Expectancy GapData visualisation revealing the disconnect between healthcare expenditure and life…
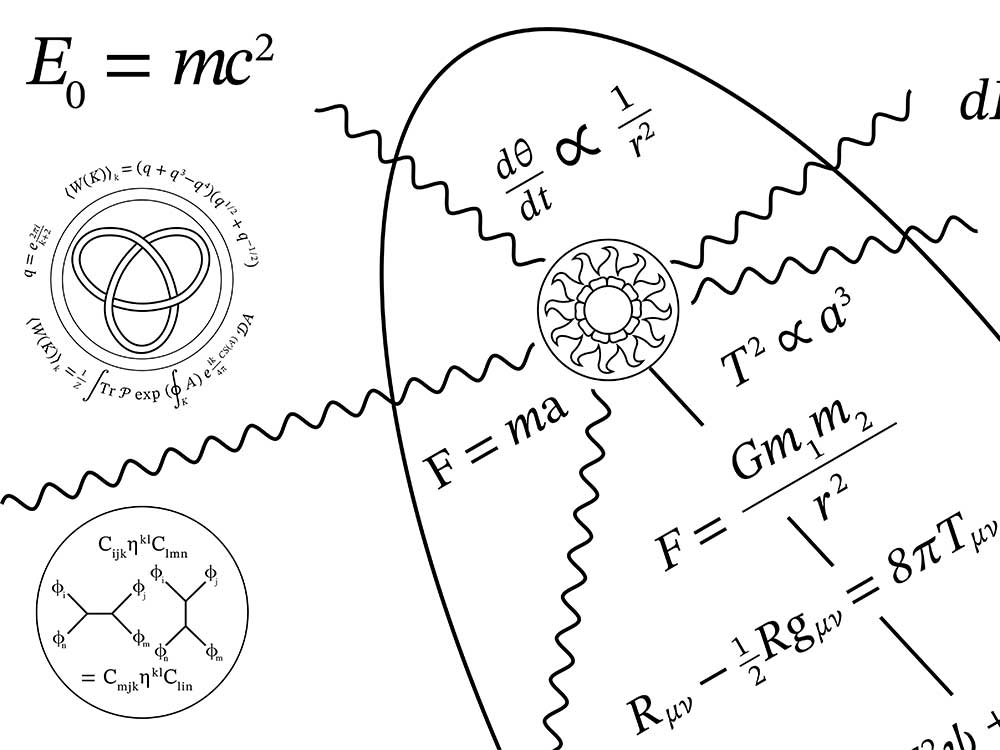
Fundamental Laws: The Physics & Mathematics of the UniverseA visual exploration of foundational physics equations, mathematical principles, and…
Zeki Talent Market: One-PagersOne-pager design system communicating the Zeki Talent Market platform to…
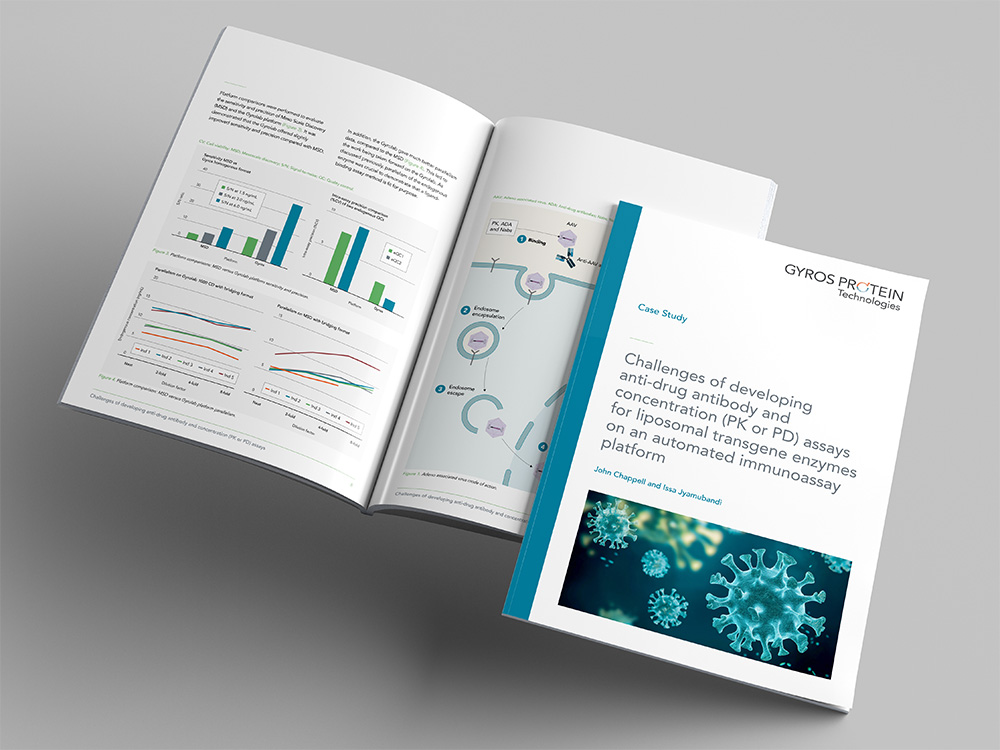
Challenges of developing anti-drug antibody and concentrationTechnical white paper translating complex bioanalytical challenges in gene therapy…
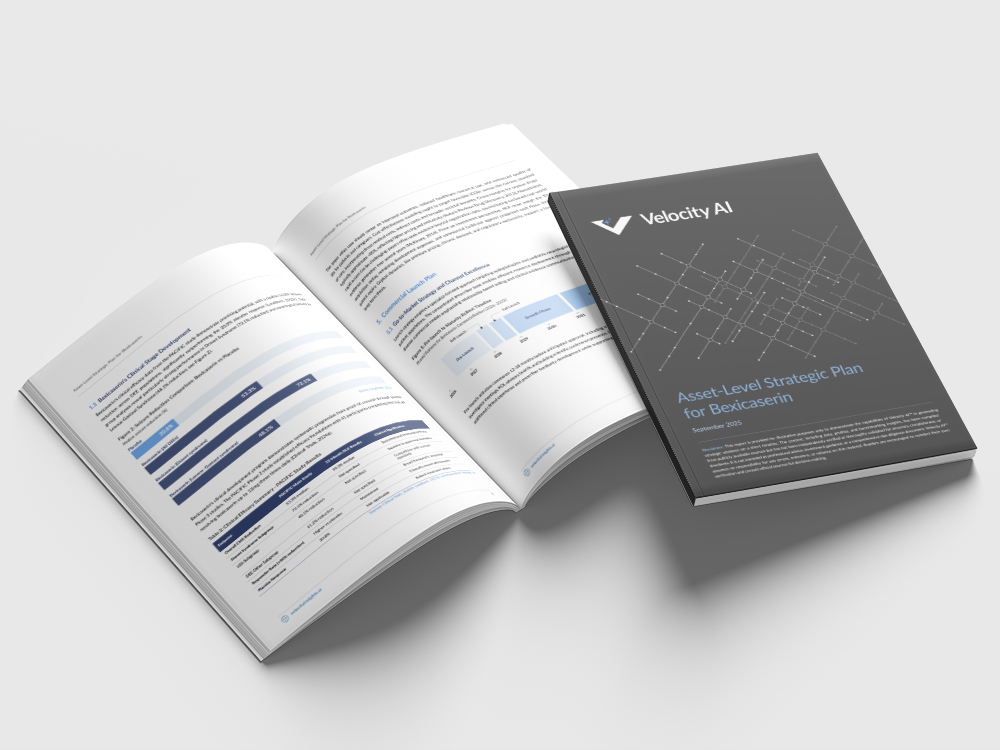
Pharmaceutical Asset Strategic Analysis: BexicaserinStrategy document design communicating a comprehensive asset-level strategic plan for…
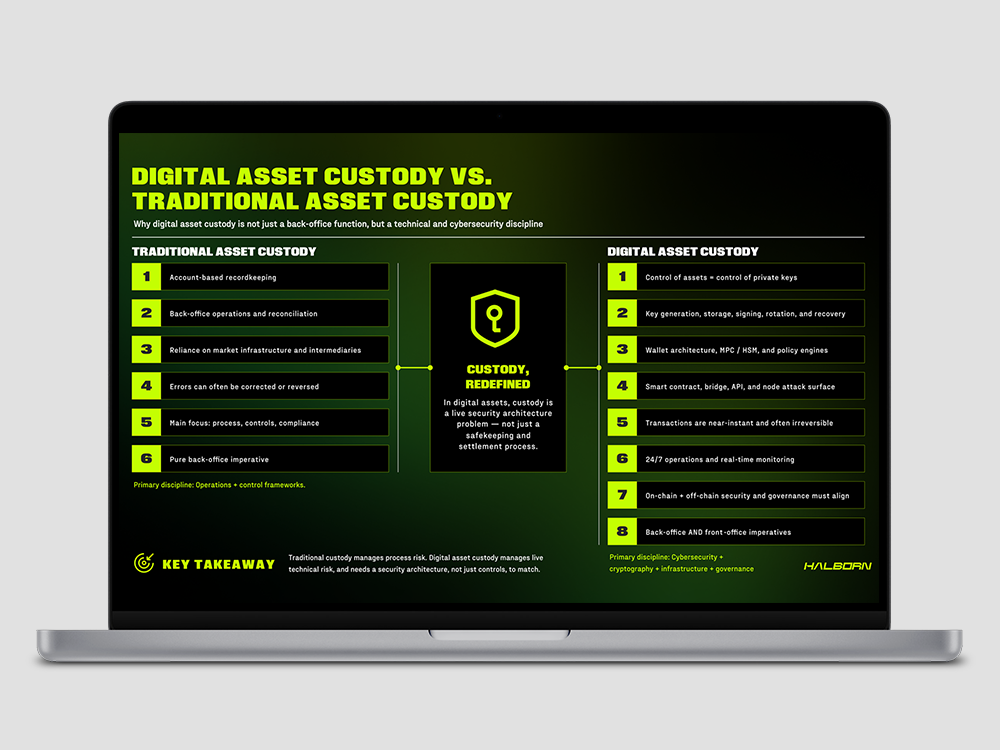
Digital Asset Custody Strategy PresentationStrategic presentation framework for institutional digital asset custody. The deck…
Commercial operations strategy input for a pharmaceutical boardAn input deck for a pharmaceutical board, covering commercial analytics,…